An AI That Orders You A Pizza If You're Sad
I. Introduction

This was actually an idea I've had for a few years! The reason it took so long was I came up with this project when I was
barely getting into Computer Vision and AI in general! I knew what I wanted to do but I wanted to spend some time understanding
the fundamentals of how AI functions before I took on a project like this. I had forgotten about this project until I found
an old note entitled Pizza AI on my computer which had notes of how I wanted this project to function! Needless to say,
I am finally at a point in which I am confident in my abilities to create functioning AI (and how to troubleshoot on my own), I knew
it was time to give this project a true go!
Using facial recognition software and a neural network, I went ahead and created an AI that will automatically order you a pizza if it
detects that you're feeling sad. Here's how I did it! And if you're a more of a visual person, I also created a YouTube video that also
goes over this project, so feel free to check that out if you'd like!
II. Building the Mood Detector
One of the first parts I had to create for this project also ended up being the most important parts. I needed to create a way for my AI to be able to detect if a person is feeling sad to begin with. In other words, I had to build a mood detector. The biggest hurdle I faced with this was trying to find a database that I could use. I was simply looking for a database that had a series of public photos displaying different emotions. Ideally, the emotions would be labeled but I was fine with anything as long as it was good quality. I found a lot of good reosurces, however, a vast majority of them were hidden behind an "academia paywall". What I mean is, I wasn't able to have access to any of the datasets unless I was in sort of academic field and I was doing research specially related to mood detection and/or creating AI to analyze peoples moods. As annoying as this was, I was able to find a website on kaggle.com -- 'ol reliable.
This was a great dataset to use because it already came with thousands of labeled images of portrait images with the mood the person is depicting in the image. In a first world problem of sorts, there was actually a bit too much data. With this dataset, the person in the image was able to display seven different emotions.
| Label | Emotion |
|---|---|
| 0 | Anger |
| 1 | Disgust |
| 2 | Fear |
| 3 | Happy |
| 4 | Sad |
| 5 | Surprise |
| 6 | Neutral |
Creating the Neural Network
Now that I have the data, it's time to start to build out the actual model itself. For this, I'm going to use Python. More specifically, I'm going to be using the tensorflow models. Given the fact that this is a project that heavily uses ComputerVision, it's best to use a convolutional neural network. Convolutional Neural Networks (CNNs) are useful when using images due to the fact that it's very good at extracting specific features found in images.
Unfortunately, I did not have tensorboard open while training this and so I don't have a good visualization of the architecture behind the model but I can show the code!
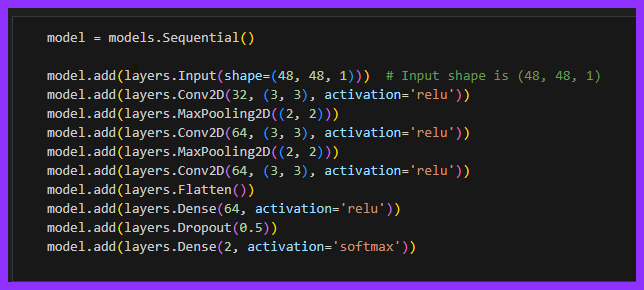
As you can see, I used a series of convolutions and pooling layers to train this model which is pretty typical for this type of model.
Something to point out is the fact that I made a note stating that the input shape is (48, 48, 1). These dimensions
represent the dimensions of that the training data is stored as; 48x48 grayscale images. The picture below is an example of one
of the "Happy" images.

Dealing with Overfitting Data
While normally we would be happy with a surplus amount of data, I was worried that having so many specific categories would lead to overfitting. Overfitting is what happens when you create a model that is a bit too catered to the training data. This is problematic because if we introduce new data that is a bit different from what we trained our model on, our model might not know how to interpret it which may lead to bad results.
To try to get around this issue, I decided to reduce the seven categoes into only two categories - Happy and Sad. For this project, I didn't really care if a person was feeling "Surprised" for example, I only needed to know if the person was feeling sad or not. From there, I immediately had to deal with another slight road bump. What was the best way to group the categories together? After some thought, I came up with three different groupings and I was going to train models for each three and whichever had the best results was going to be the model we would use going forward.
-
Model 1: Group
Angry,Disgust,Fear, andSurprisein the "Sad" category and have the rest be "Happy" -
Model 2: Group
Angry,Disgust,Fear, andSurprisein the "Sad" category and have the rest be "Happy" but dropNeutral -
Model 3: Drop all categories except for
HappyandSad
As one might suspect, I used Python to relabel all of the data before training them based on the models criteria. If we look at the training plots for each of the models, we can see something pretty interesting. The model that drops all of the faces except for the happy and sad ones appears to produce a better model when compared to the other two models that try to group the different labels together. We notice this because both the training and validation accuracies seem to increase at a decent pace in a similar fashion.
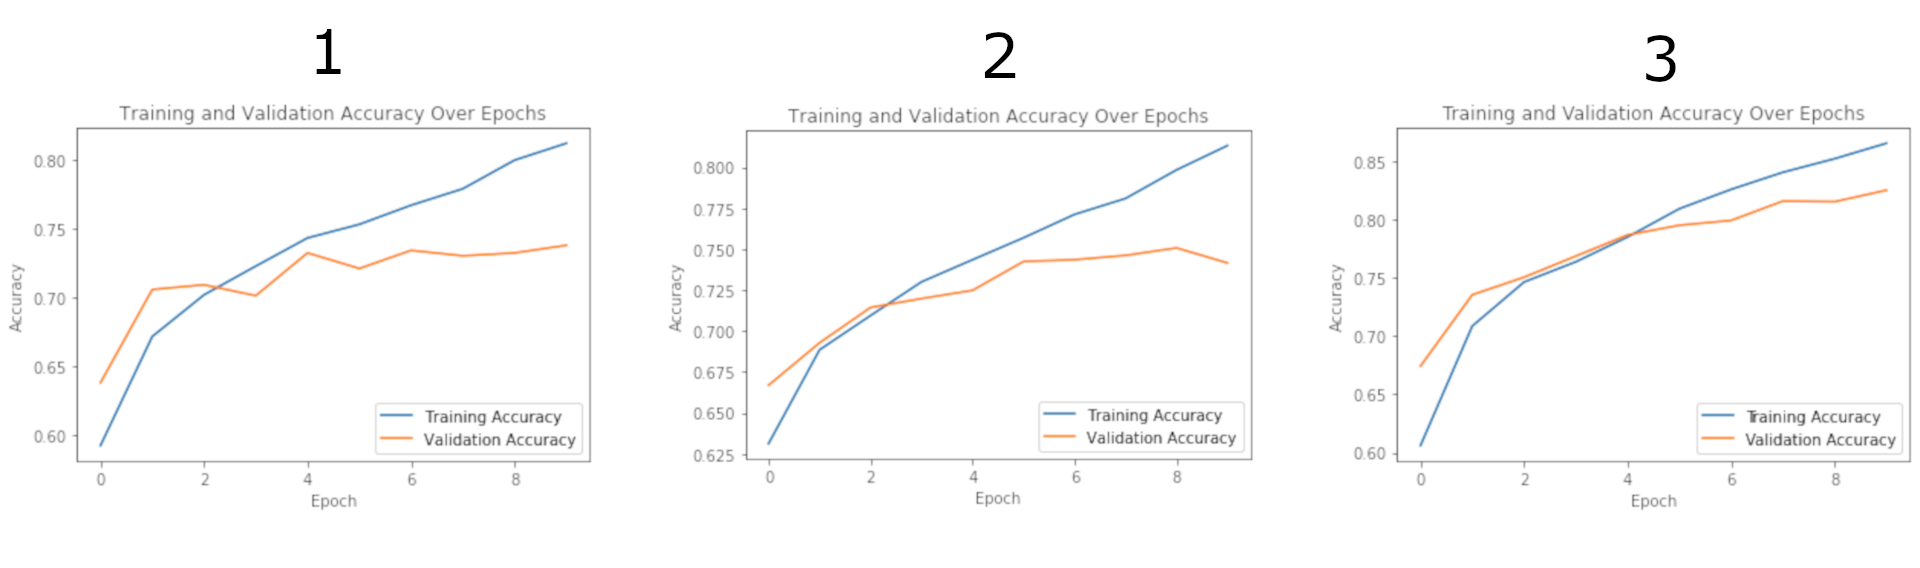
So what does it mean when the validiation accuracy appears to flatline while the training accuracy increases as is shown in the first two models? Well this means that the model is beginning to overfit! The model is starting to pick up on more and more specific characterstics that aren't all that helpful when trying to identify new data. It's for that reason that the model "seems" to get better but if we try using it in practice, it's not that good.
We can take a look at the actual metrics of each model to better understand the performances after 10 epochs.
| Model | Loss | Accuracy |
|---|---|---|
| 1 | 0.5377 | 0.7377 |
| 2 | 0.5261 | 0.7490 |
| 3 | 0.3453 | 0.8506 |
The metrics help confirm what we already expected by looking at the plots. Dropping all of the data except for the Happy and Sad values yields the best results.
Using Our Own Data
So now that we have a model, it's now time to try to use our own data with it. This step is not usually one that you highlight, but rather, it's one that you just "do". However, there is a pretty cool transformation involved with this step that I really wanted to show off!
Remember how I stated that all of the training data was formatted as a 48x48 grayscale image? Well, that means that every image that we input also has to follow in the same format. That means, if we want to use our own data, we have to make sure that it's also a 48x48 grayscale image. It would be too much work and an inconvenience to have to manually reformat every single image to fit this criteria. Plus, we want to eventually use this model on live footage.
To fix this,